Unlock the Full Potential of Your Performance Max Campaigns!
Discover how this Performance Max script can transform your data into actionable strategies and boost your ROI.

Spend Allocation
Account-level insights with metrics for each of the four channels, as well as visuals & a table showing all campaign metrics in one place.
Search Categories
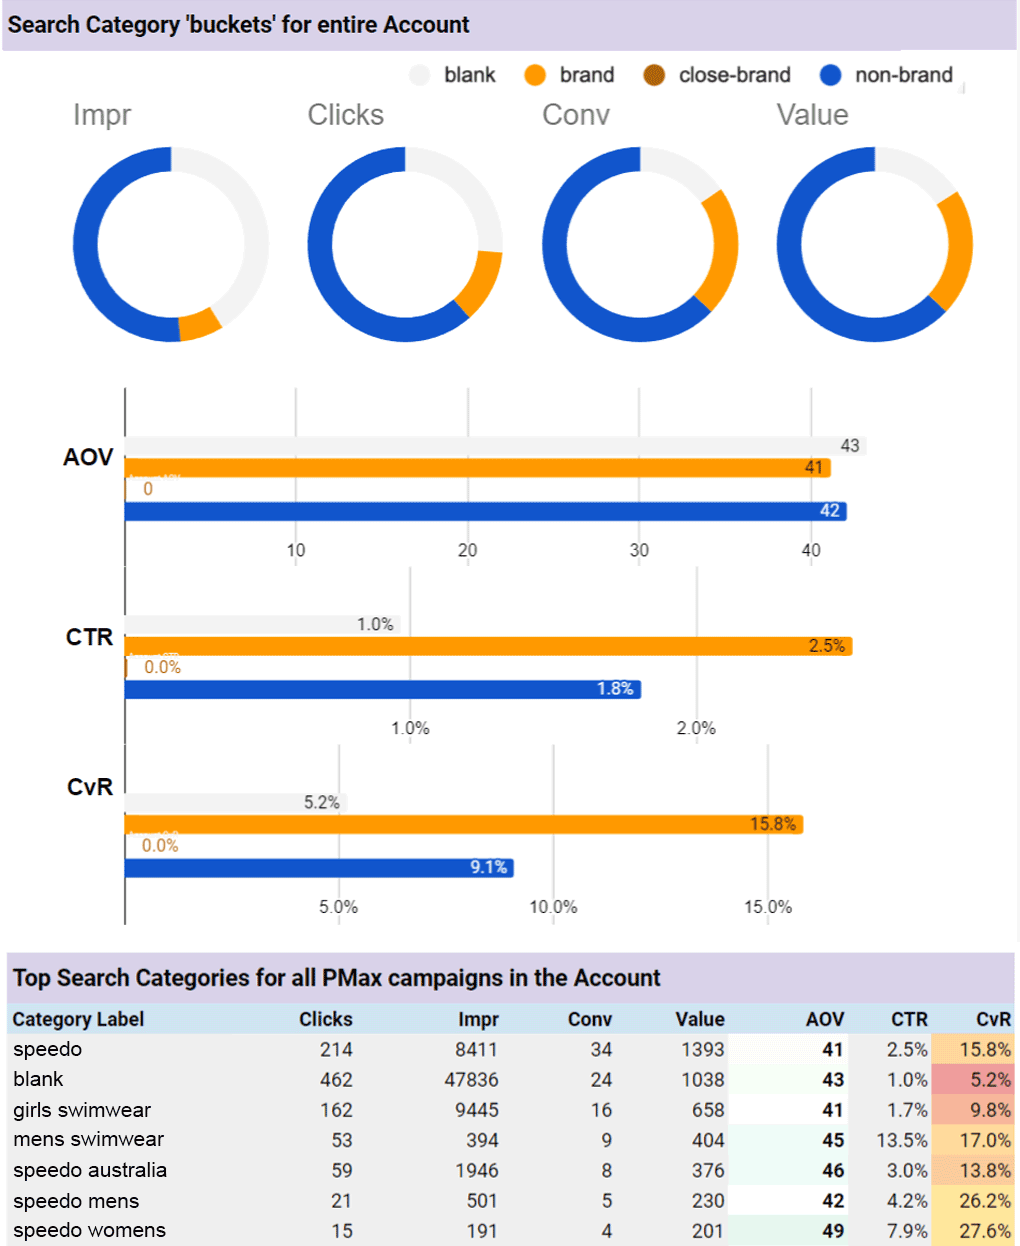
View the key performance metrics of the top search categories, allowing you to make more informed decisions about where to focus your efforts.

Product Matrix
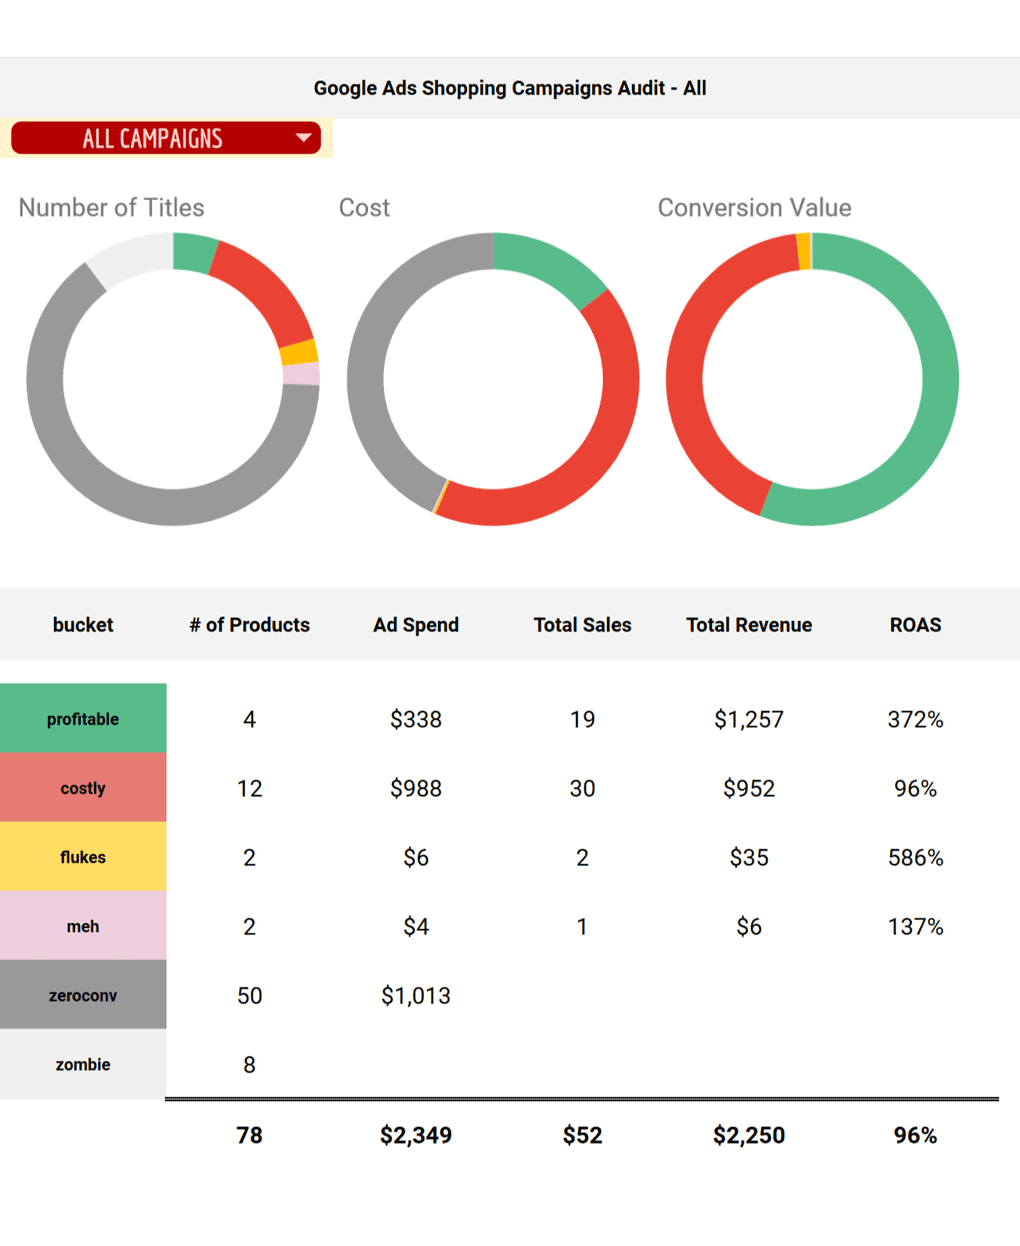
Visualise your products performance and place them into performance buckets, allowing you to focus on more profitable products and higher ROI.

Asset Groups
Takes the guesswork out of managing all your asset groups, providing an overview of all the important key metrics right at your fingertips.

Asset Insights
Learn more about your Performance Max assets including headlines, descriptions, images & videos with key performance metrics.

N-Gram Reports
With the Ngram report, you’ll get segmented insights into your product title keywords, allowing you to customise your feed for further testing.

Free Updates
You won’t have to worry about it becoming obsolete, allowing you to focus more on optimising your campaigns and less on the tools you use.

Premium Support
20 hours of workshop recordings to get you up & running. Still got a question? A dedicated support forum to answer any question you have.
You can choose between a single account script, or the MCC script version.
Both come with free, lifetime updates and support.

Understand Your Spend Allocation
From inside your account report, you’ll get a better understanding of how Google is spending your ad spend in the following areas:
- Ad spend by channel across all Performance Max & Shopping campaigns.
- Cost & Conversions split for selected campaigns across Search, Shopping, Video & Display.
- Segmentation across your brand, close to brand and non-branded keywords.
- Top search categories, sorted by impressions, clicks, conversions and value.
Metrics For Your Search Categories
Improve your campaign management in your Search campaigns by enabling you to view the performance of the top search categories.
- Provides a comprehensive view of all search category data in the account.
- Displays average order value, click-through rate, and conversion rate for search categories.
- Enables detailed charts on brand and close to brand terms.
- Table data changes dynamically based on the sorting metric chosen.


Segment Products by Their Performance
Products are shown by total cost, conversions, conversion value, ROAS, POAS and profit, categorised into six buckets based on predefined thresholds:
- Profitable: Exceed cost and ROAS thresholds.
- Costly: Above cost threshold, below ROAS
- Flukes: Below cost, but above ROAS threshold
- Meh: Below cost and ROAS thresholds.
- Zeroconv: Products with spend but no conversions.
- Zombie: Products with impressions but no clicks or spend.
Measure Asset Group Performance
Allows you to visualise the performance across all your campaign asset groups, allowing you to quickly visualise your next steps.
- Provides a comprehensive view of all asset group data in the account.
- Inclusion of CPA, added for lead gen accounts focusing on CPA instead of value and ROAS.
- Provides key metrics including cost, conversions, CTR, Conversion Rate and Average Order Value.


Performance Max Asset Metrics
Get a better understanding how your Performance Max assets are performing, including headlines, descriptions, videos & images:
- For video and display assets, the option to show thumbnails.
- Consideration of the amount spent on each type of asset for context.
- Options to sort by cost or other metrics and choose the number of rows displayed.
- For video and display assets, the option to show thumbnails.
